621 copies of one helper: how a VS Code extension took 18 GB of my 16 GB Mac
· Sidhanth Pandey
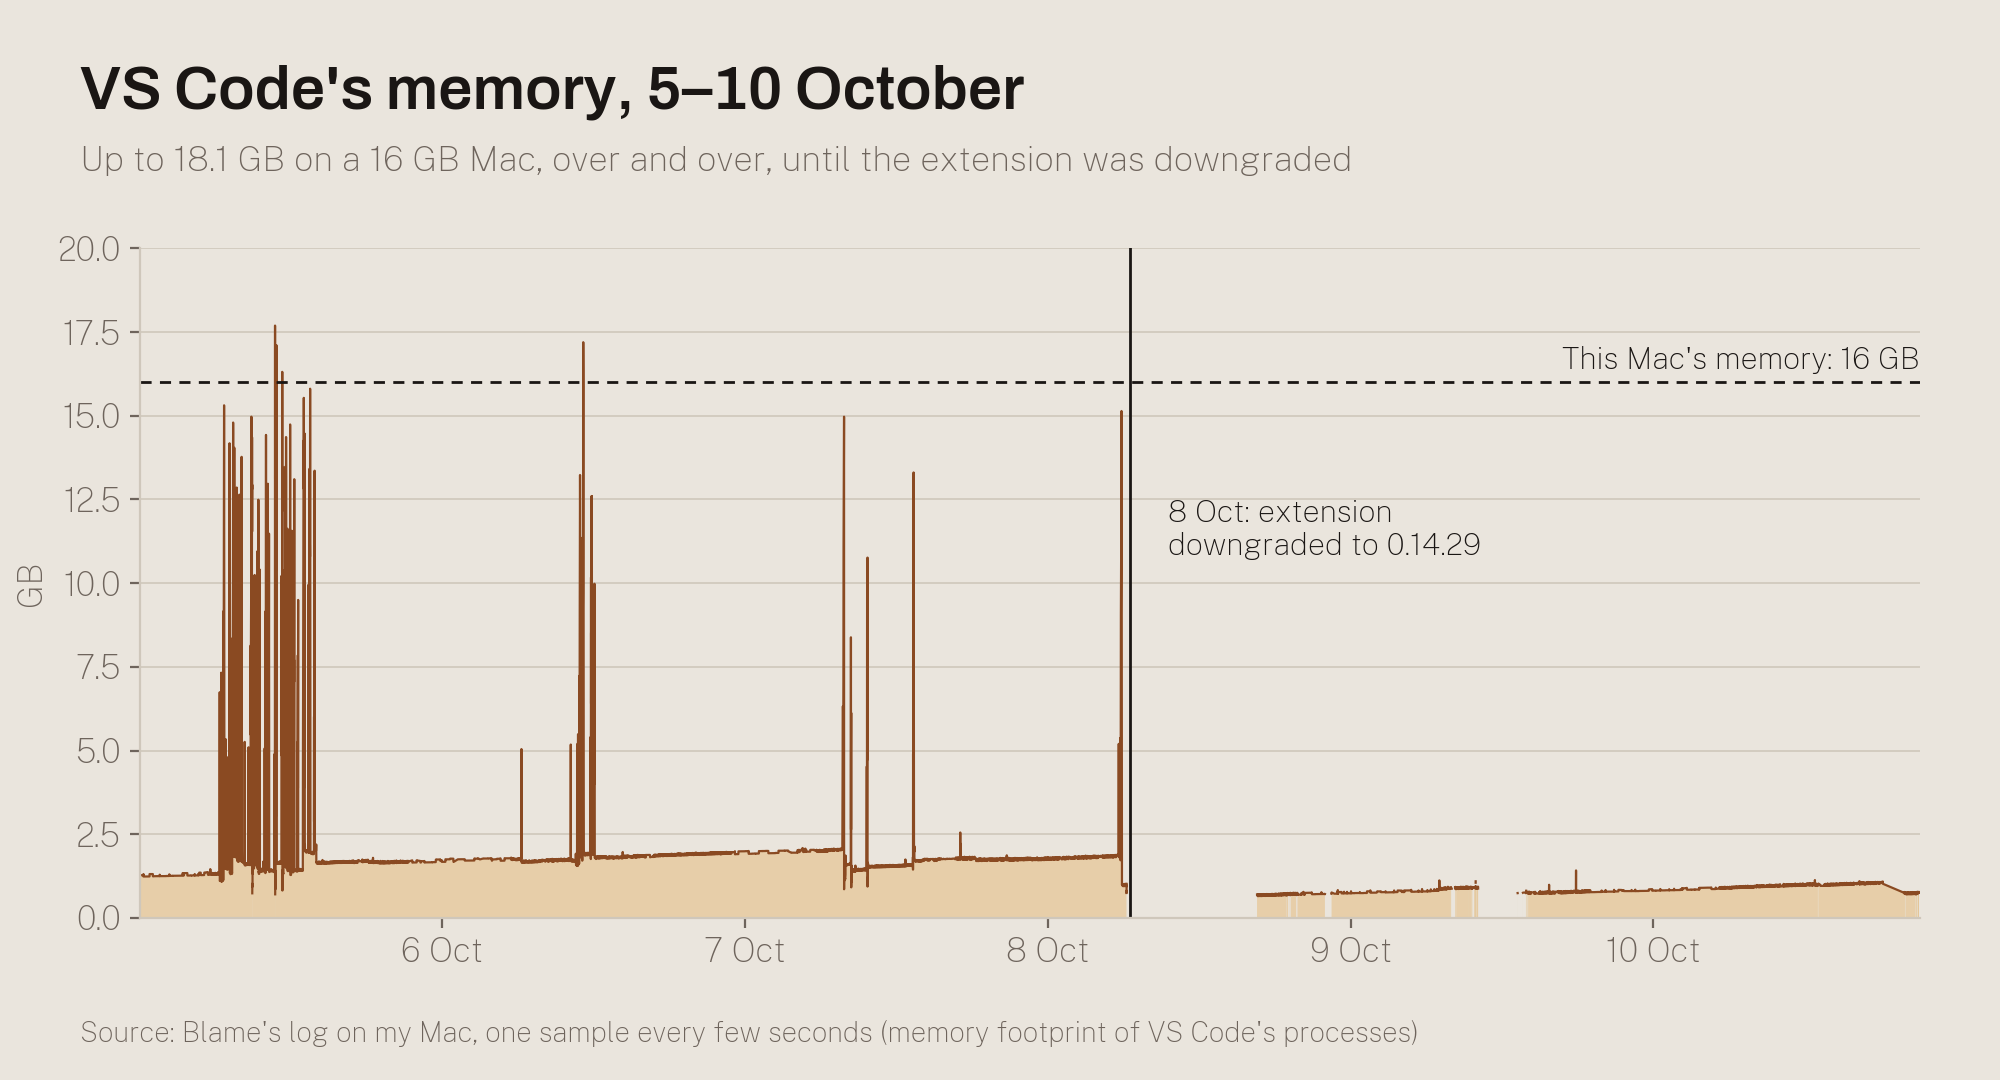
On 5 October my Mac warned me eleven times that VS Code was eating memory. Not slowly. "Visual Studio Code grew from 1.4 GB to 14.8 GB in 14 min." Forty minutes later, "1.4 GB to 13.7 GB in 2 min." By the afternoon, "2.0 GB to 12.1 GB in 1 min."
It's a 16 GB Mac. Each time, free memory sat at 13–14%, macOS was writing up to 175 MB a second to swap, and the load average went as high as 982. Everything else I had open slowed to a crawl while it happened.
It kept happening: 18 warnings in four days, and at its worst VS Code held 18.1 GB. This is what was going on, how I found it, and how to check whether it's happening to you.
It wasn't VS Code
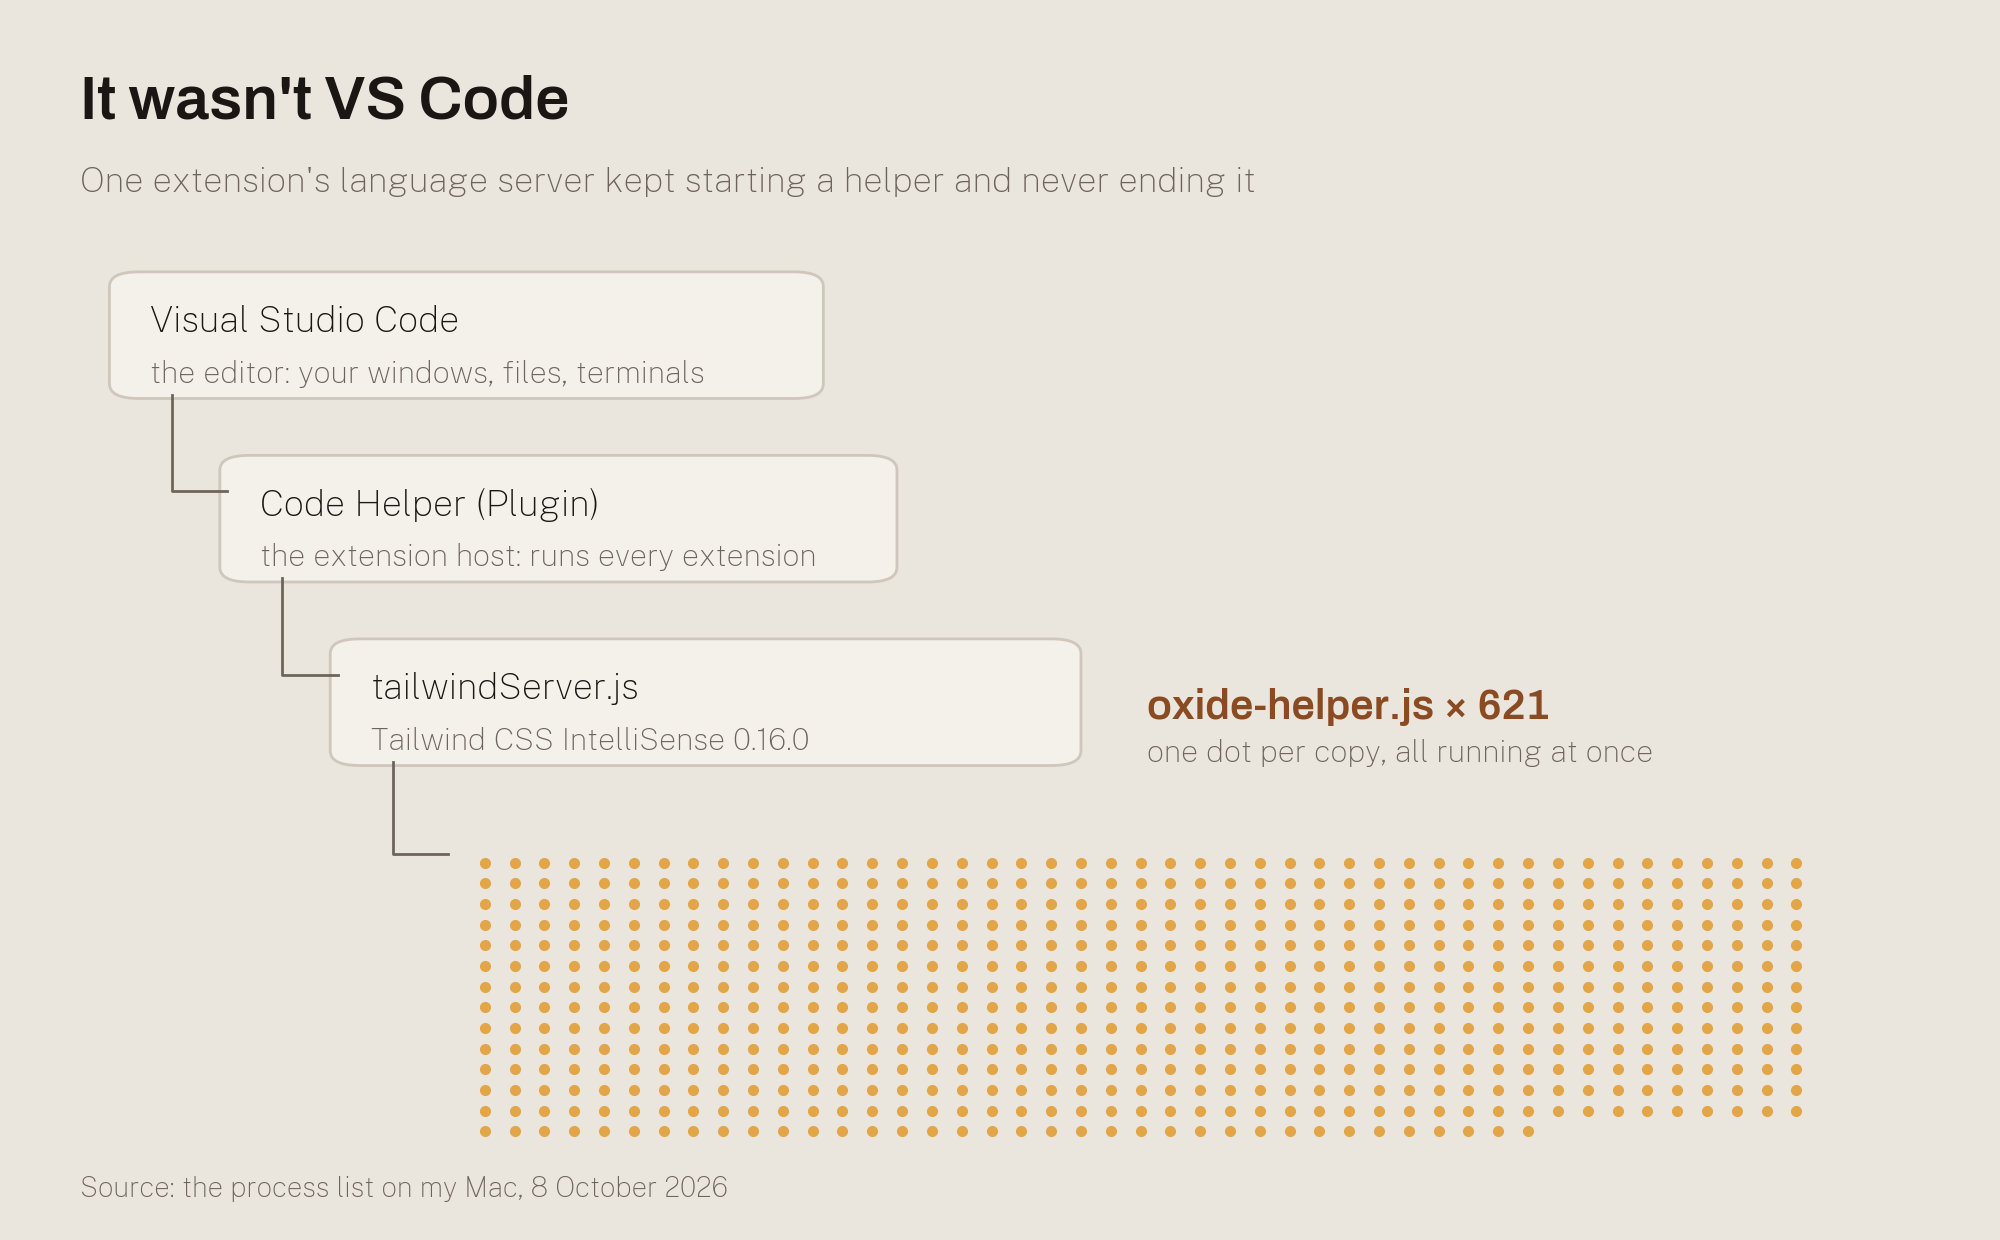
VS Code runs your extensions in a separate process, the extension host, and an extension's language server runs as a child of that. In Activity Monitor all of it shows up as "Code Helper (Plugin)", so what I saw was a wall of identical rows and no name to blame.
Looking at the process tree told a different story. One process, Tailwind CSS IntelliSense's language server (tailwindServer.js, version 0.16.0 of the extension), kept starting copies of a helper called oxide-helper.js and never ending them. Snapshots taken during the blow-ups counted 142, 151, 60 and 131 copies at a time.
The worst one came on the morning of 8 October:
- 621 copies of oxide-helper.js
- 15.1 GB held by VS Code, on a Mac with 16 GB of memory
- 13% of memory free, and 17.3 GB of swap in use, with 13 GB of disk left for it to grow into
- a load average that had peaked at 785
At that point the Mac isn't slow, it's about to stop.
Restarting the extensions fixed it, for a while
The quick fix is to restart VS Code's extensions without closing your windows: Command Palette, "Developer: Restart Extension Host". The host and everything under it end, VS Code starts them again within seconds, and your windows, unsaved files and terminals stay where they were.
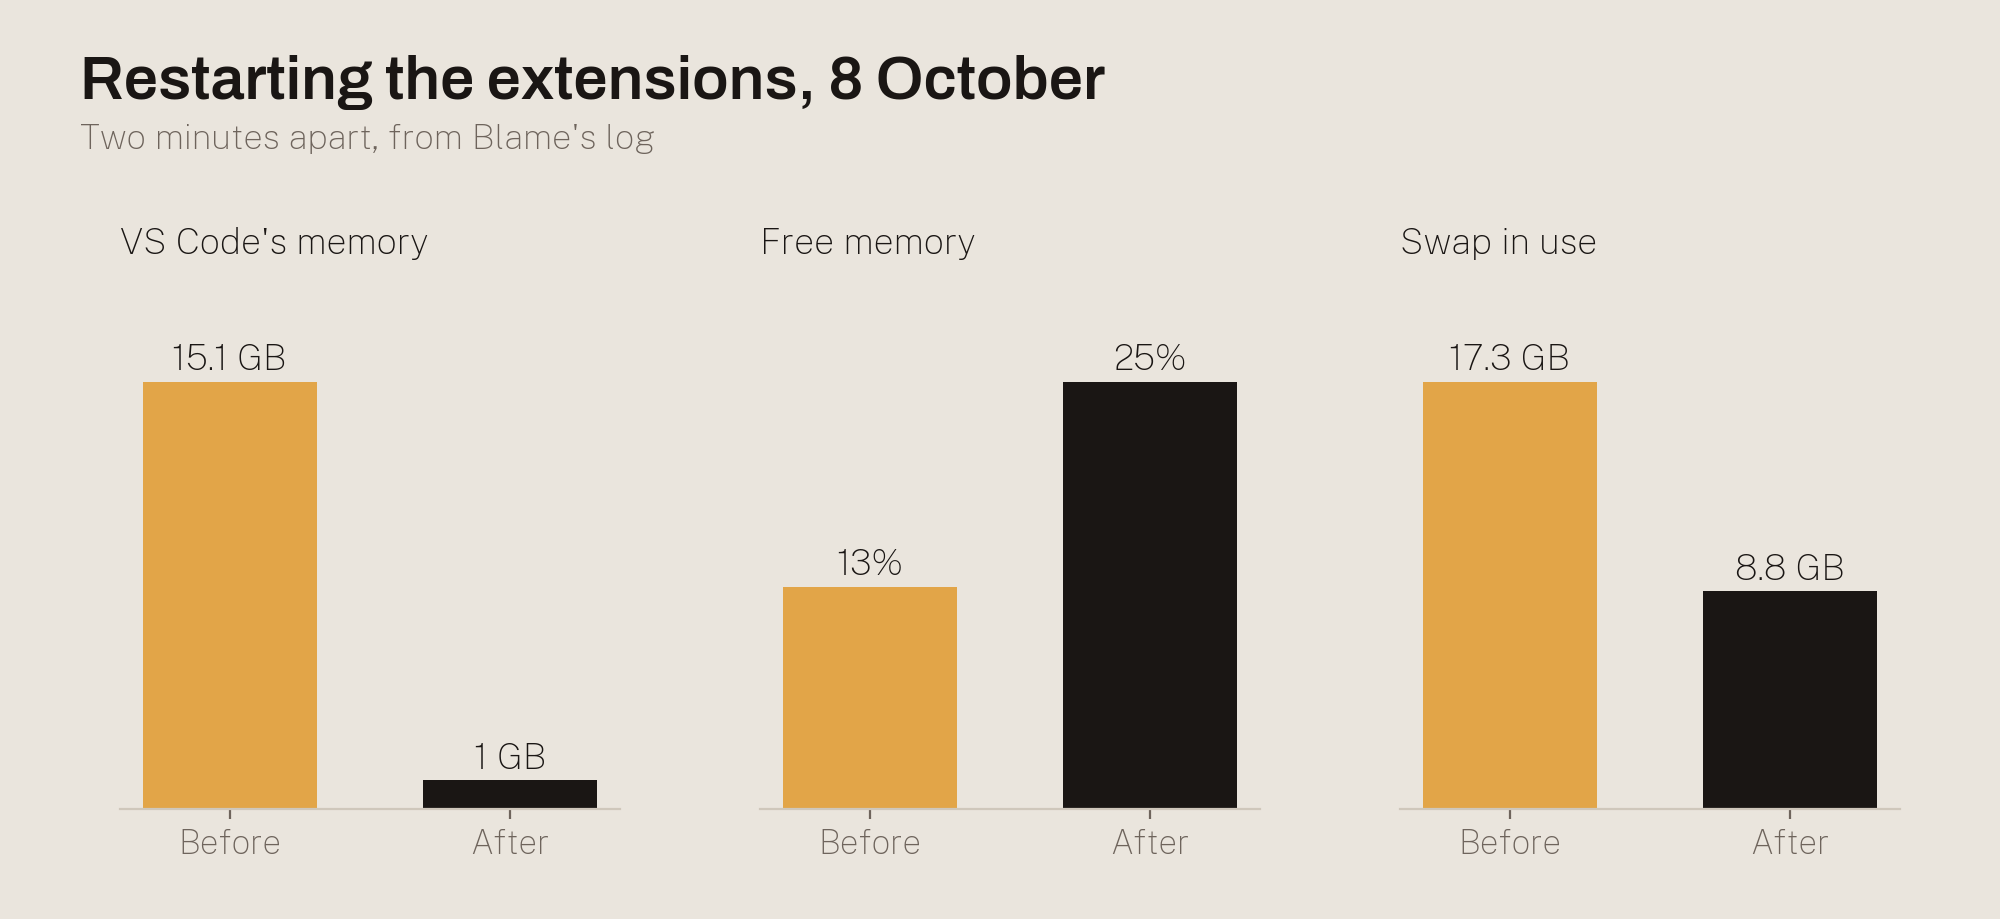
On 8 October, two minutes after the restart, VS Code was down from 15.1 GB to 1.0 GB. Free memory went from 13% to 25%, and swap dropped from 17.3 GB to 8.8 GB.
But it came back. On 5 October the warnings arrived every 30 to 60 minutes, because the language server started piling up helpers again as soon as it was running. A restart is a bandage.
The real fix
I downgraded Tailwind CSS IntelliSense from 0.16.0 to 0.14.29. In the three days since, VS Code hasn't grown like that once.
To do the same: Extensions view, Tailwind CSS IntelliSense, the gear icon, "Install Specific Version…", then pick 0.14.29. Turn off auto-update for that extension, or it will put 0.16 back.
It's a known problem. There's an open issue on the extension's repository describing the same thing, gigabytes of memory and many Code Helper processes: tailwindlabs/tailwindcss-intellisense#1553.
How to check yours
If VS Code suddenly holds gigabytes, count the helpers in Terminal with ps -axo command= | grep -c '[o]xide-helper'.
A handful is normal while the language server works. Dozens or hundreds that keep growing is this problem.
For any extension, not just Tailwind, VS Code can tell you which one is busy: Command Palette, "Developer: Show Running Extensions".
Why I care about this one
I'm building Blame, a Mac app that tells you why your Mac is slow and what's safe to end. This blow-up is how I found out what it has to be good at.
The first thing that helped wasn't freeing memory. It was naming the cause. "Visual Studio Code grew from 1.8 GB to 11.3 GB in 3 min" is useful. "Tailwind CSS IntelliSense's language server has started 621 copies of oxide-helper.js and not ended them" is what tells you to downgrade an extension instead of restarting your Mac.
Blame now says that, and offers the extension restart as one click, with your windows left alone. It's free at getblame.app.